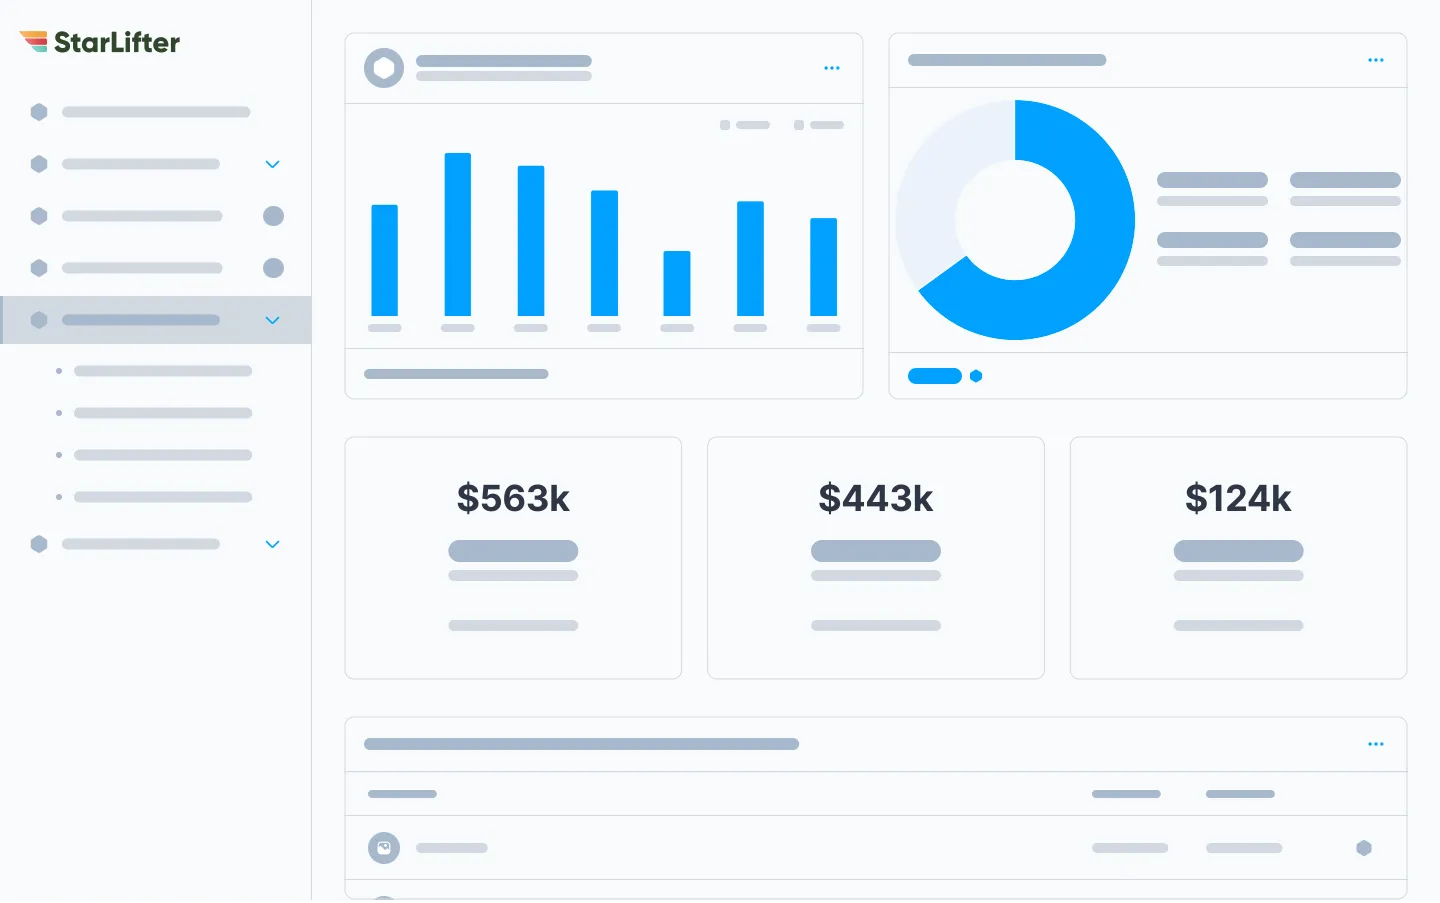
The All-in-One Platform
for True Revenue Visibility

Unify data from sales, marketing, customer success and more to help
RevOps leaders analyze and forecast with clarity and make strategic moves.
Finally...the BI power you need with none of the headache.

Problem

The Struggle for Clarity

Hierarchy 4 Streamline Icon: https://streamlinehq.com

No Single Source of Truth

Your data’s all over the place: Salesforce, spreadsheets, HubSpot, and other rogue point solutions you may not even know about. 

No Poverty Streamline Icon: https://streamlinehq.com

Never-Ending Demands

Sales wants one thing, the CFO needs another, and the CRO keeps changing the way they want reports. You may as well add “expert juggler” to your resume.

Ai Prompt Spark Streamline Icon: https://streamlinehq.com

Too Many Manual Processes

You're back in a spreadsheet aggregating, spot-checking and obsessing about your data before a meeting versus advising your team on outcomes.

Solution

StarLifter ends the chaos

We bring all your data into one platform, ready to go with pre-mapped, customizable dashboards. So instead of wasting time piecing together reports, you’ll have answers when you need them—fast. Pinpoint pipeline issues, call your forecasts, and provide revenue insights that matter, without the manual work.

1
Connect data together

Finally, a Single Source of Truth

All data in one platform

Combine system data and spreadsheets

Clear, consolidated revenue view

Unify Data (No, Really!)

Blend data from multiple CRMs, marketing platforms, and finance systems, giving you a complete view of revenue performance in one place.

No Developer Required

Unlike traditional tools, StarLifter connects data from any source without needing a developer. Jump right into analysis with pre-mapped KPI dashboards.

2
BI-level analysis

Advanced Analytical Power

Real-time pipeline insights

Historical comparisons from any time

Segment by territory, product, rep and more

Point-In-Time Precision

Compare current performance against quarterly targets, last year’s data, or even the average over the last five quarters.

Your Next Question Answered

Spend your time surfacing variances and taking action versus building calculations after the fact.

3
Analysis & Forecast

Analyze & Forecast in One Place

Centralize all revenue insights

Blend and automate forecasting processes

Validate forecasts across multiple methods

Call the Number with Confidence

Automate your forecasting process tracking shifts week by week whether it's bottoms-up calls from sales, weighted CRM calculations, or CRO predictions.

Aggregate Toolsets Together

No need to toggle back and forth from your forecasting tool and your pipeline analysis. Do them both in StarLifter.

4
Easy to use

Configurable & Flexible

Customizable metrics and targets

No developer needed for setup

Adaptable to any business model

Designed for All Stakeholders

Whether you need to customize your ARR calculation or handle requests like Booked vs. Realized revenue, StarLifter provides the flexibility you need to manage it all in one platform.

No Boundaries to Your Analysis

Avoid the export button. StarLifter is designed for you to make any change on the fly. Keep up on the revolving door of requests without hacking together something just in time.

Competitive Differentiation

How are we different?

Lorem ipsum dolor sit amet, consectetur adipiscing elit.

SalesOps Tools
CRM
Business Intelligence
StarLifter
How StarLifter does this
Feature Category
Blend Any Data for Unlimited Revenue Visibility
Schemaless - we ingest any data… marketing, sales, customer, product, finance, targets, you name it. No limit to the size of data
Designed to Accept Complex Tech Stacks - like Multiple CRMs
We are schemaless. We know data models and we know revenue operations.
Trend Time Travel Data
Yes. Takes snapshots, limiting
Change data capture… tracking every change.Optimized for BIG data… (super nerds would get a kick out of the fact that we are not doing snapshots on a daily, weekly, monthly basis) we are tracking the changes
Limitless Flexibility of Custom Metrics & Targets Beyond Quota
Super easy to use… but super powerful.  For example.. I can create my own calculations, I can modify charts, it is not just see and no touch like Tableau, for Clari I have to call someone…
Analysis and Process
Super easy to use… but super powerful.  For example.. I can create my own calculations, I can modify charts, it is not just see and no touch like Tableau, for Clari I have to call someone…
Configurable Templates

Essential RevOps Jobs
Made Easy

Sharing quarterly performance data doesn’t have to be a
time-consuming task—it’s all ready to go with just a few clicks.

Quickly identify where deals are getting stuck and uncover opportunities to improve conversion rates.

Review historical accuracy, track pipeline progress, and keep your forecasts grounded in real-time data, free from human error.

Stay ahead of the game when your CRO asks,
“How do we measure and monitor this?”

Customer testimonials

Lorem ipsum dolor sit amet, consectetur adipiscing elit.

My ability to select the deals and accounts I want to look at and filter in any way I want is the real differentiator of StarLifter. When I meet with my sales leaders, this gives me my narrative. With other tools or even my CRM, I have to take the data out and use pivot tables to get there. It’s manual and time consuming.
Rich Caproni
VP of RevOps
With StarLifter, leaders like me can avoid the first of the morning message that says, “how is lead flow going?” Insead, I’m driving. “Hey - I noticed a dip in lead flow.” Here’s where it is and here’s what we should do about it.
Mallory Lee
RevOps Consultant
When selecting a BI tool, it’s critical to think of all aspects, from ease of use and UI to the integrations that it works with. Starlifter not only provides a top-of-the-line solution for visualizing your data but makes it simple to join complex data sources across your business to know where you’re doing well and where there are opportunities
Tyler Piotrowski
Director of RevOps
Before using StarLifter, we didn’t have good visibility into our goals and our data was siloed between leaders. Now that I’ve set up our reporting, we can segment our data more granularly, make it available to everyone, and I don’t have to touch it every day - it just works
Tyler Markelin
VP of RevOps

Experience the Power
and Simplicity